Visualization
4. Visualization#
import pyrfume

try:
    import seaborn as sns

    sns.set(font_scale=1.5)
    sns.set_style("whitegrid")
except:
    pass  # Seaborn is not installed

molecules = pyrfume.load_data("my_data/molecules.csv")  # Load the data from the last chapter
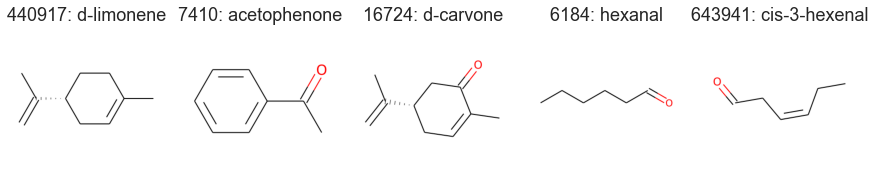
Now that our molecules have standard representations (from Part 2), we can easily visualize them:
from pyrfume.odorants import display_molecules

display_molecules(molecules)
Or we can ask where they live in low-dimensional spaces built from features, compared with other odorous molecules.
from pyrfume.odorants import embed_molecules

acetophenone = molecules.loc[[7410]]
embed_molecules(acetophenone)
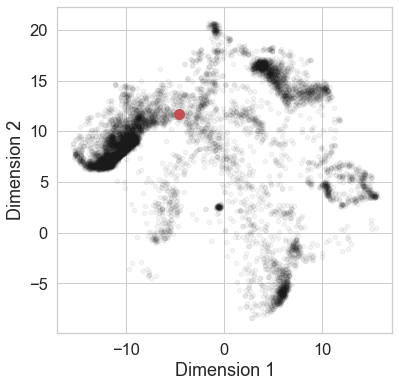
The above shows thousands of molecules from the Pyrfume database (black) and acetophenone in red, using a 2-dimensional UMAP embedding built from those thousands of molecules.